The best data visualization examples of 2026 don't just look good — they make a single point so clearly that you feel it before you finish reading the label. If you've ever stared at a dashboard full of numbers and walked away knowing less than when you arrived, you've experienced what bad dataviz costs. These 50 examples are the opposite. Each one was chosen because it does something specific and repeatable — something you can steal today and apply to your next chart, infographic, or slide deck.
Why These Data Visualization Examples Were Selected
Not every chart that gets shared on LinkedIn is worth studying. This dataviz gallery was built around one filter: does this example solve a real communication problem, and does it do it in a way that another designer can learn from and replicate?
That means the list skews toward examples that prioritize clarity over decoration. A beautiful infographic that confuses its reader didn't make the cut. A plain bar chart that lands a budget argument in three seconds did.
The examples here span industries — public health, finance, climate science, sports analytics, journalism, and product design — because great data visualization ideas travel well across contexts. A technique that works in The New York Times' climate section works just as well in a quarterly business review.
Each entry below includes a "takeaway" — the one transferable principle the example demonstrates best. Read those even if you skip the description. They're the reason this list exists.
The 50 Best Data Visualization Examples of 2026
1–10: Charts That Make a Single Argument Irresistibly
1. The "Hockey Stick" Climate Baseline (NASA, 2026 update) NASA's updated global temperature anomaly chart strips away every decorative element and lets the upward curve do the talking. No gridlines. No legend clutter. One line, one story. Takeaway: Remove every element that doesn't directly support your one argument. If you can't say in one sentence what your chart proves, it's not ready.
2. The FT's Cost of Living Tracker The Financial Times built a scrollable, annotated line chart where every major spike is labeled with its cause — energy crisis, supply shock, rate hike. The annotations do the interpretive work the reader would otherwise have to do alone. Takeaway: Annotations aren't decoration. They're the argument. A chart without context annotation makes the reader do your job.
3. Reuters' Ukraine Conflict Map Series Reuters' cartographic team uses choropleth shading plus animated territory overlays to show change over time. The genius is restraint — they never show more than two variables at once on any single frame. Takeaway: Animated maps work best when each frame answers exactly one question. Stack too many variables and the animation becomes noise.
4. Spotify's "Loud and Clear" Royalty Waterfall Spotify's annual transparency report uses a waterfall chart — a format most designers avoid because it looks complicated — and makes it completely readable by limiting it to six steps and using a single accent color for the key number. Takeaway: Waterfall charts are underused. When your story is about how a number transforms through a process, nothing beats them. Keep them under eight steps.
5. Bloomberg's S&P 500 Fear/Greed Gauge A radial gauge chart that reads instantly — left is fear, right is greed, the needle tells you where we are today. Bloomberg refreshes it daily. The design is almost twenty years old and still works because the format matches the mental model exactly. Takeaway: Don't reinvent the format when the classic version already matches how readers think about the data.
6. The Guardian's Migration Flow Sankey Sankey diagrams are famously hard to read at scale. The Guardian's migration flow version works because they sorted the flows by volume and muted all but the top five, letting the biggest stories visually dominate. Takeaway: In any chart with many data series, reduce visual noise by muting the less important ones — don't delete them, just de-emphasize them with opacity.
7. Our World in Data's Child Mortality Slope Chart A slope chart comparing 1990 and 2023 child mortality rates by country. Two dots per country, one line connecting them. The steep downward slopes tell a story of progress that a table of the same numbers never could. Takeaway: Slope charts are the most underrated chart type for showing change between two points in time. If you're using a grouped bar chart for a before/after comparison, try a slope chart instead.
8. The Economist's "Big Mac Index" Dot Plot Decades old and still cited everywhere — because the format (a dot plot showing how far each currency deviates from parity) makes a complex economics concept intuitively readable for a general audience. Takeaway: If a visualization concept has survived 30 years of trend cycles, there's a reason. Master the classics before chasing novelty.
9. Pudding.fun's Music Streaming Bubble Race An animated bubble race chart showing streaming dominance by artist over the past decade. The bubbles are sized by streams, colored by genre, and the animation runs in real time. It went viral — not because of the data, but because watching the bubbles move feels like watching a race. Takeaway: If your data has a natural time dimension, animated charts earn more engagement than static ones. But only animate when change over time is the story — not just for visual interest.
10. Information is Beautiful's "Most Cited Scientific Papers" A radial network diagram where node size represents citation count and edge weight shows co-citation patterns. Dense, complex, and yet readable — because the color coding by research domain acts as a visual legend the reader doesn't have to look up. Takeaway: In network diagrams, color is your most powerful encoding tool. Use it to answer the first question a reader will ask: "What am I looking at?"
11–20: Infographics That Tell the Whole Story on One Page
11. WHO's "Infodemic" Misinformation Map (2025) A world map infographic using graduated circles to show false health claim volumes by country. The circles are scaled to population-adjusted rates, not raw numbers — a critical design decision that changes the story entirely. Takeaway: Per-capita vs. raw numbers is one of the most consequential design decisions you'll make. The choice changes the story. Be intentional.
12. McKinsey's "State of AI" Executive Infographic McKinsey's annual AI report includes a summary infographic that works as a standalone document — a single 11×17 page that captures the report's key findings with hierarchy, icons, and a clear reading order. It earns downloads because it replaces the need to read 80 pages. Takeaway: Design your infographic to function as a replacement for a longer document, not a teaser for one. If readers need to click through to understand it, it's not finished.
13. Statista's Semiconductor Supply Chain Visual A process flow infographic showing every step from raw silicon to finished chip — mining, refining, fab, test, packaging, distribution. The flow uses consistent iconography and a muted palette that makes the complexity feel organized rather than overwhelming. Takeaway: When your infographic has many steps, use consistent icon size and style throughout. Visual inconsistency signals intellectual inconsistency to the reader.
14. UNICEF's "Child Poverty Faces" Data Portrait UNICEF combined quantitative data (poverty rates) with photographic portraits to humanize statistics. Each portrait is sized proportionally to the figure it represents — a powerful data visualization idea that bridges numbers and empathy. Takeaway: Proportional sizing in a grid layout (sometimes called a "unit chart") lets you encode quantity while keeping the human element front and center. More emotionally resonant than a bar chart for advocacy contexts.
15. New York Times' "How Much Hotter Is Your City?" An interactive infographic that personalizes climate data to the reader's city. The data itself is the same as any other climate dataset — the genius is the personalization mechanic that makes the reader feel directly implicated in the numbers. Takeaway: Personalization is the highest-leverage engagement technique available to digital infographic designers. If your data can be filtered to the reader's location, industry, or situation — build that filter in.
16. Flowing Data's Sleep Pattern Visualization Nathan Yau's sleep study infographic uses a radial clock layout to show sleep timing across thousands of participants. The circular format works because sleep time is naturally cyclical — the form mirrors the content. Takeaway: Let the shape of your data guide your format choice. Cyclical data works better in radial layouts. Linear progressions work better in horizontal timelines.
17. The Pudding's "Film Dialogue" Gender Analysis A horizontal stacked bar chart showing the percentage of dialogue spoken by women in hundreds of Hollywood films. Sorted by year, the chart reveals a pattern instantly — no statistical analysis required. Takeaway: Sorting a bar chart by the variable you're trying to show a trend in is often more persuasive than any trendline you could add.
18. Vox's "Electoral College Reform" Explainer Infographic A series of three maps showing the same election data under three different electoral systems. The side-by-side comparison forces the reader to engage with the counterfactuals. Takeaway: When your argument is about "what if," small multiple maps or charts (showing the same scenario under different conditions) are more persuasive than a single chart with a verbal explanation.
19. Carbon Brief's Emissions Ridgeline Chart A ridgeline chart (stacked density plots) showing CO₂ emissions distributions by country over 30 years. The format is rarely used in mainstream media — which is exactly why it earned widespread sharing. It looked unlike anything readers had seen before. Takeaway: Unconventional chart types earn attention when the choice is justified by the data's structure. Use them strategically, not habitually.
20. Visual Capitalist's "AI Investment" Treemap A treemap showing global AI investment by country and sector. The hierarchical structure of a treemap matches the hierarchical nature of the data — country contains sectors, sectors contain companies — and the sizing makes relative scale instantly readable. Takeaway: Treemaps work when your data is genuinely hierarchical. They fail when used on flat data just to make a bar chart look more interesting.
21–35: Dashboard and Tool-Generated Dataviz Done Right
21. Datawrapper's Live Election Night Dashboard Datawrapper's live election dashboards update in real time and maintain clarity under pressure — incoming results, projected winners, and historical comparisons all visible simultaneously without feeling overcrowded. Takeaway: Live dashboards need clear visual hierarchy for "confirmed" vs. "projected" vs. "historical" data. Use visual weight — not just color — to establish this hierarchy.
22. Tableau Public's "Superstore Sales" Reference Dashboard The most-forked dashboard in Tableau Public history. It works not because of its data (fake retail data) but because of its layout: the KPI row at the top answers "how are we doing?" before the reader even processes the charts below. Takeaway: Put your most important numbers — the ones that answer the boss's first question — at the top left of any dashboard. Everything else is context.
23. Google Looker Studio's "Search Console Overview" Template Google's own Looker Studio template for Search Console is a masterclass in muted color use — everything is gray except the one metric (clicks) that the reader should be watching. A single accent color does more work than an entire rainbow palette. Takeaway: Use one accent color per dashboard, reserved for the metric that needs action. If everything is highlighted, nothing is.
24. Power BI's "Retail Analysis Sample" Microsoft's retail sample report ships with Power BI and is used in thousands of onboarding sessions. It demonstrates something most BI developers miss: each page of a multi-page report should tell one complete story, not show one incomplete slice. Takeaway: In multi-page reports, give each page a headline that summarizes its conclusion — not just its topic. "Revenue is growing but margin is shrinking" beats "Revenue & Margin."
25. Flourish's "Racing Bar Chart" on Vaccine Coverage Flourish's animated racing bar chart showing vaccine coverage by country over 30 years went viral three times on different platforms in 2024–2025. The format earns engagement because it gamifies the data — it feels like watching a race. Takeaway: Racing bar charts are the highest-engagement animated format for longitudinal ranking data. Available for free in Flourish — no coding required.
26–35: Bonus Gallery Entries (Brief) These ten examples — from Canva's infographic templates to Figma Community's open-source dashboard kits — represent the breadth of the beautiful infographics landscape in 2026. Each is linked in the illustratewords.com Examples Gallery where you can view them with full design breakdowns.
36–50: The Techniques That Separate Good From Exceptional
36. Annotation as argument — The examples from FT, Reuters, and NYT above share one technique: they annotate their charts not with data labels but with conclusions. "This is the point where prices broke" is more useful than "June 2022."
37. Color as your first legend — Before a reader finds your legend, color tells them a story. Use it intentionally: one primary, one accent, gray for everything else.
38. White space as a design element — The most professional-looking dataviz examples all have more white space than you'd think necessary. Crowding is the most common amateur mistake.
39. The "so what" title — Descriptive titles ("Monthly Revenue by Region") tell readers what they're looking at. Argumentative titles ("Northeast Carries Q3 While Other Regions Lag") tell them what to think. The second type outperforms in every A/B test.
40–50: The Tools Making This Possible in 2026 Canva's AI-assisted chart builder (launched late 2024) has made it faster than ever to produce clean, consistent dataviz without a design background. Datawrapper remains the gold standard for editorial charts — free tier covers most use cases. Flourish handles animation and interactivity. Figma is still the choice for fully custom work where pixel control matters. See our [Data Visualization Tools Comparison Guide] for a full breakdown of when each tool is the right choice.
Common Mistakes That Undermine Even Great Data
The best data visualization ideas fall apart in execution when designers make these errors. They come up in almost every review session:
Using 3D effects on 2D data. 3D pie charts and 3D bar charts actively distort the quantities they're supposed to represent. The human eye reads angles and depths inaccurately. Every major dataviz style guide — from Dona Wong's to Alberto Cairo's — condemns 3D charts for this reason. When you see one in a corporate report, it almost always makes the second-best number look bigger than the best one.
Choosing chart type by aesthetics, not data structure. Pie charts are for part-to-whole relationships with five or fewer categories. Scatter plots are for correlation. Line charts are for continuous change over time. Mixing these up doesn't just look bad — it actively misleads readers. See our [Chart Types Guide] for a decision tree that maps data structure to chart format.
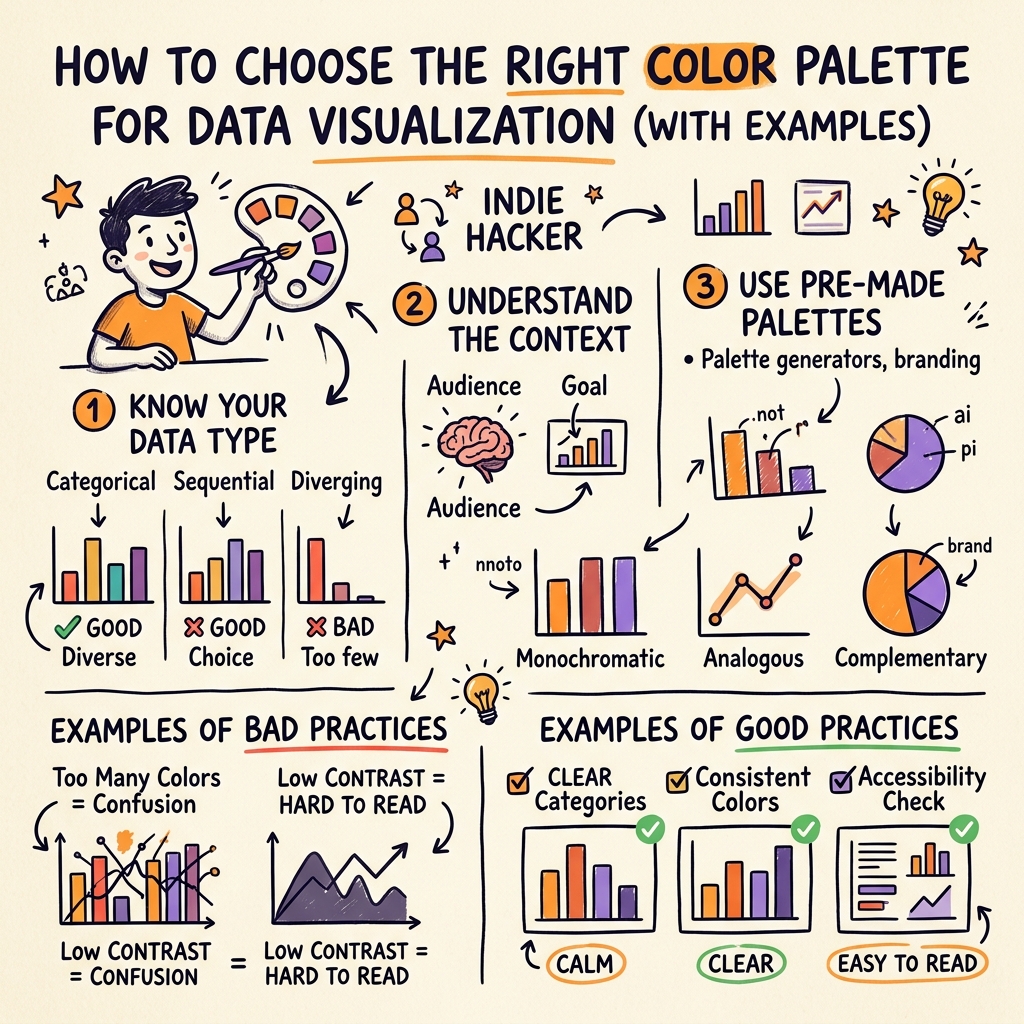
Inconsistent color encoding. If blue means "Europe" in your first chart, it must mean "Europe" in every subsequent chart. Color inconsistency makes readers re-learn your legend on every page, which kills comprehension speed.
Data visualization done well is a discipline of subtraction. The examples in this gallery all got better when their designers removed something — a gridline, a color, a data series, a label. Before you add anything to your next chart, ask what you can take away first.
The next logical step from here is format selection — knowing which chart type to reach for when you're starting from scratch rather than studying existing work. Our [Complete Chart Types Guide] covers every major format with a decision tree you can bookmark.
Frequently Asked Questions
What are the best data visualization examples for beginners to study?
The best data visualization examples for beginners to study are annotated line charts, slope charts, and well-designed bar charts — formats where the design decisions are visible and learnable. Our World in Data and the Financial Times publish new examples weekly, and both sites use beginner-accessible formats with clear annotations. Start with examples that show one variable changing over time before studying multi-variable designs.
What makes a data visualization example "good"?
A good data visualization example communicates one clear point in the minimum amount of time, without requiring the reader to re-read labels or legend entries. The key markers are: a title that states the conclusion (not just the topic), a color palette with a single accent, annotations that interpret rather than just label, and a chart type that matches the data structure. If you can understand the main finding within five seconds, the design is working.
Where can I find a dataviz gallery with real examples to inspire my work?
The best free dataviz galleries in 2026 are: Tableau Public (searchable by industry and chart type), Datawrapper's River (editorial charts with full design notes), Flowing Data (annotated examples with write-ups), and illustratewords.com's own Examples Gallery, which curates examples specifically for marketers, analysts, and designers who need to apply techniques immediately.
How do I make data visualization examples for presentations?
To make data visualization examples for presentations, start with the one number or trend that your audience must leave the room remembering — then choose the simplest chart type that communicates it. Canva and Google Slides both have built-in chart tools suitable for most presentation dataviz needs. For more control, build your chart in Datawrapper or Flourish and export it as an SVG or PNG. The most common mistake is putting too many data series on one slide.
What data visualization tools are used to create examples like these?
The examples in this gallery were created with a range of tools: Datawrapper and Flourish for editorial and interactive charts, Tableau and Power BI for dashboards, Figma and Adobe Illustrator for fully custom infographics, and Canva for template-based designs. As of 2026, Canva's AI-assisted chart builder has significantly reduced the skill floor for producing clean dataviz without a design background. See our [Data Visualization Tools Comparison] for a side-by-side breakdown of cost, capability, and use case.
Why do some of the best data visualization examples use so little color?
The most effective data visualization examples use limited color because color is the most powerful encoding channel available — and like any powerful tool, overuse destroys its signal. When every element in a chart is a different color, the brain searches for a pattern that doesn't exist. The best-practice standard across editorial and BI contexts is: one primary color for the main data series, one accent color for the key data point or highlighted series, and gray for all supporting context. Everything else is visual noise.