Choosing the right color palette for data visualization is the difference between a chart that makes its point in half a second and one that leaves readers squinting at a legend, trying to figure out which shade of blue means what. Most people treat color as decoration — something to add once the chart is "done." That's backwards. Color is doing real communicative work, encoding meaning the same way axis labels and chart type do. Get it wrong and even a well-structured chart falls apart. This guide walks through the three palette types you actually need, how to pick between them, and how to keep your choices colorblind-safe without sacrificing style.
Why Color Choice Makes or Breaks a Chart
Every color decision in a chart sends a signal, whether you intend it to or not. A rainbow of unrelated hues tells the brain "these categories are all equally different from each other," which is often false — and it forces the eye to hunt for a pattern that doesn't exist. Good use of color palette for data visualization does the opposite: it groups what belongs together and separates what doesn't, before the reader has consciously processed a single number.
This matters more as dashboards and reports get denser. A stakeholder scanning a slide for three seconds should walk away with the right takeaway, not a headache. Visual hierarchy — what draws the eye first, second, third — is built largely through color, not just size or position. If every element competes for attention with a different bright hue, nothing wins, and the chart reads as noise instead of an argument.
The Three Palette Types You Need to Know
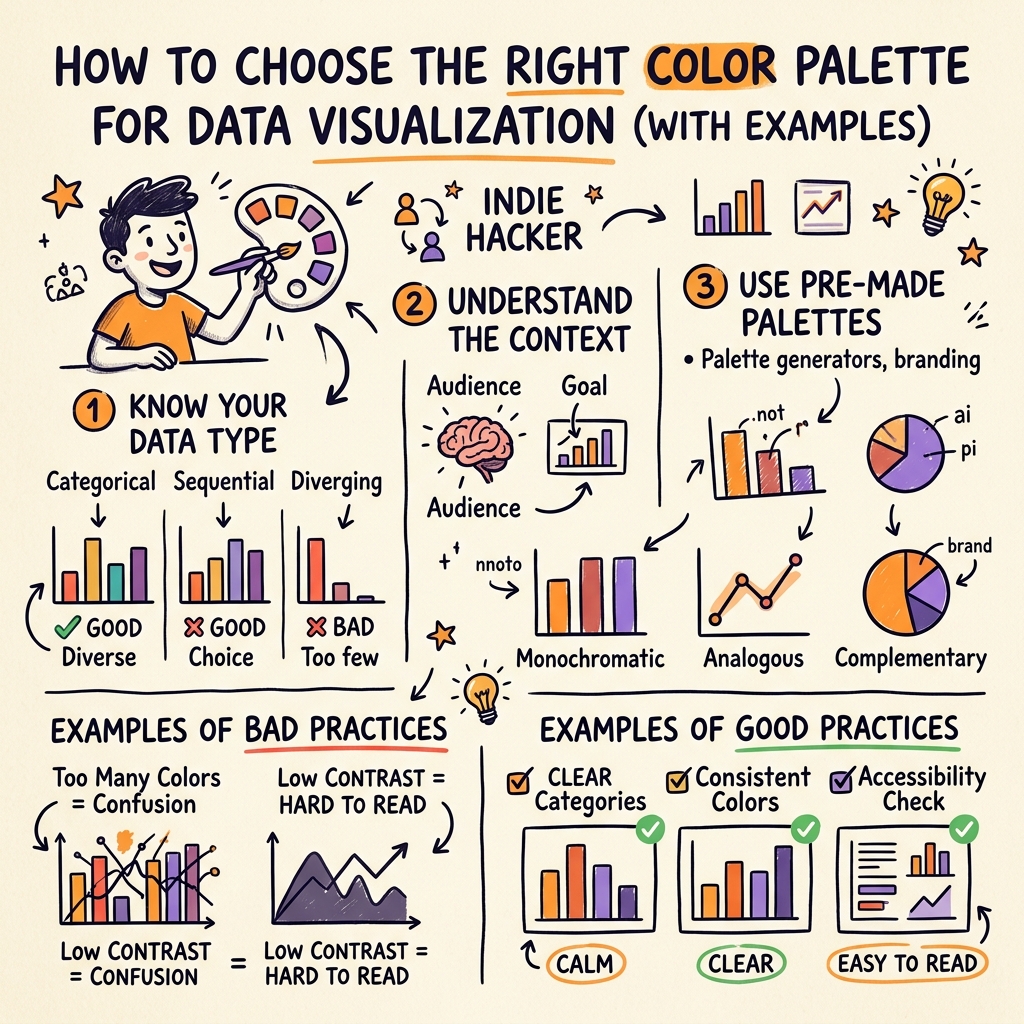
Almost every data visualization palette falls into one of three families, and picking the wrong one is the single most common mistake in chart design.
1. Sequential palettes use one hue in a gradient from light to dark, and they're built for data that runs low to high — population density, temperature, revenue by region. Think pale blue scaling up to navy.
2. Diverging palettes use two contrasting hues that meet at a neutral midpoint, ideal for data with a meaningful center point like "above or below average" or "positive versus negative change." A common pairing is deep red through white to deep blue.
3. Categorical (qualitative) palettes use distinct, unrelated hues for data with no inherent order — product lines, regions, or survey answer options — and should be capped at five or six colors before the eye starts losing track.
The sequential vs diverging palette decision comes down to one question: does your data have a natural zero or midpoint? If yes, diverge. If it's just a range from small to large, go sequential. Mixing the two — say, using a diverging palette on data that has no real center — is a fast way to imply a false narrative about what "normal" looks like.
Building a Palette That's Actually Colorblind-Safe
Roughly 1 in 12 men and 1 in 200 women have some form of color vision deficiency, most commonly red-green. If your chart relies on red-versus-green to convey meaning, a meaningful share of your audience is reading a different chart than you designed. This is where data viz color theory earns its keep instead of staying theoretical.
Practical fixes that hold up in real dashboards:
- Swap red-green diverging pairs for blue-orange or purple-orange, which stay distinguishable across the most common forms of color blindness.
- Test your palette in Datawrapper's built-in colorblind-safe checker or Coblis before publishing, not after a stakeholder flags it.
- Never rely on color alone to carry meaning — pair it with position, labels, or icons so the message survives even in grayscale.
- Keep contrast high between adjacent colors; two similar mid-tones next to each other fail even for viewers with normal color vision.
Colorblind safe palettes aren't a compliance checkbox — they're simply better design, because they force you to build charts that communicate through more than one channel at once.
Applying This Across Canva, Figma, and Datawrapper
The principles stay the same across tools, but the workflow differs. In Canva, you can lock a sequential or diverging palette into your Brand Kit so every chart element pulls from the same swatches automatically — useful if you're producing a lot of social infographics on a deadline. Figma users get more granular control through color styles and variables, which is worth the setup time if you're building a reusable dashboard template used across a team.
Datawrapper and Flourish both ship with pre-built, tested colorblind-safe palettes for exactly this reason — when in doubt, start from one of their defaults rather than building from scratch. The most common mistake across all three tools is picking a palette that looks great in the software's default light-mode preview, then exporting it for a dark-mode presentation or a printed report where the same colors go muddy or lose contrast entirely. Always preview your export in its actual final environment before calling it done.
One case where you should break from palette rules entirely: single-highlight charts, where 90% of the chart is gray and one bar or line gets a single accent color. This isn't a "palette" in the traditional sense, but it's often the single most effective color decision you can make when you need one number to matter more than the rest.
The One Mistake Almost Every Chart Makes
Assigning a different color to every single category "for visual interest" is the most common color mistake in data visualization, and it's almost always a downgrade. If you have twelve product categories, a twelve-color palette doesn't help the reader — it overwhelms them. Group the categories, gray out the ones that aren't the point, and let one or two colors do the actual work of guiding attention. See our Chart Types Guide for how palette choice pairs with chart selection to reinforce the same message rather than fighting it.
Choosing the right color palette for data visualization comes down to matching the palette family to your data's structure, then protecting that choice with a colorblind-safe check before it ships. Once your palette is locked, the next design decision worth getting right is typography — the wrong font pairing can undercut even a perfectly chosen color scheme.
Frequently Asked Questions
What is the best color palette for data visualization?
There's no single best palette — it depends on your data structure. Use sequential palettes for low-to-high data, diverging palettes for data with a meaningful midpoint, and categorical palettes for unordered groups, capped at five or six distinct hues.
How do I make my charts colorblind-friendly?
Avoid red-green combinations, which fail for the most common form of color blindness. Use blue-orange or purple-orange for diverging data, test your palette in a tool like Coblis, and never rely on color alone — pair it with labels or icons.
What's the difference between sequential and diverging color palettes?
Sequential palettes use one hue in a light-to-dark gradient for data that only increases, like revenue or density. Diverging palettes use two contrasting hues meeting at a neutral midpoint, built for data centered around a meaningful zero, like profit versus loss.
How many colors should a chart use?
Categorical charts should cap at five or six distinct colors before viewers start losing track of which is which. Beyond that, group less important categories into a single "other" color or gray them out to keep focus on what matters.
Can I use my brand colors as a data visualization palette?
Sometimes, but brand palettes are often built for logos, not charts, and may not have enough contrast or the right structure for sequential or diverging data. Test your brand colors against a colorblind-safe checker before locking them into a dashboard template.