Picking the wrong chart type is one of the fastest ways to undermine an otherwise solid data visualization — a 3D pie chart can make a 40% share look smaller than a 25% share, and a line chart applied to unrelated categories implies a trend that doesn't exist. This data visualization types chart guide breaks down the major chart families, what each one actually communicates well, and where each one quietly misleads. By the end, choosing the right chart should feel like matching a tool to a job rather than guessing.
Why Chart Selection Matters More Than Chart Design
It's tempting to think a chart's success comes down to color and polish, but the underlying chart type does most of the communicative work before any styling decision happens. A beautifully designed pie chart with twelve slices is still unreadable, no matter how good the color palette is.
The right framework is to start with the question your data answers, not the chart you find visually appealing. Are you comparing categories? Showing change over time? Revealing a relationship between two variables? Each of these questions has a chart type that's been proven, through decades of perceptual research, to communicate that specific relationship most accurately. Skipping this step and picking a chart because it "looks more interesting" is the single most common cause of confusing data visualization, and it's avoidable once you internalize which chart answers which question.
Bar Chart vs Pie Chart vs Scatter Plot: When to Use Each
The three most common chart types each serve a distinct purpose, and mixing them up is the most frequent mistake in business and editorial data visualization alike.
| Chart Type | Best For | Avoid When |
|---|---|---|
| Bar Chart | Comparing values across categories (sales by region) | You have more than 10–12 categories |
| Pie Chart | Showing parts of a single whole, 2–4 segments max | You have more than 5 slices or need precise comparison |
| Scatter Plot | Showing the relationship between two numeric variables | One variable is categorical, not continuous |
| Line Chart | Showing change over a continuous time period | Categories aren't sequential or time-based |
| Stacked Bar | Showing both totals and category breakdown together | You need to compare individual segments precisely |
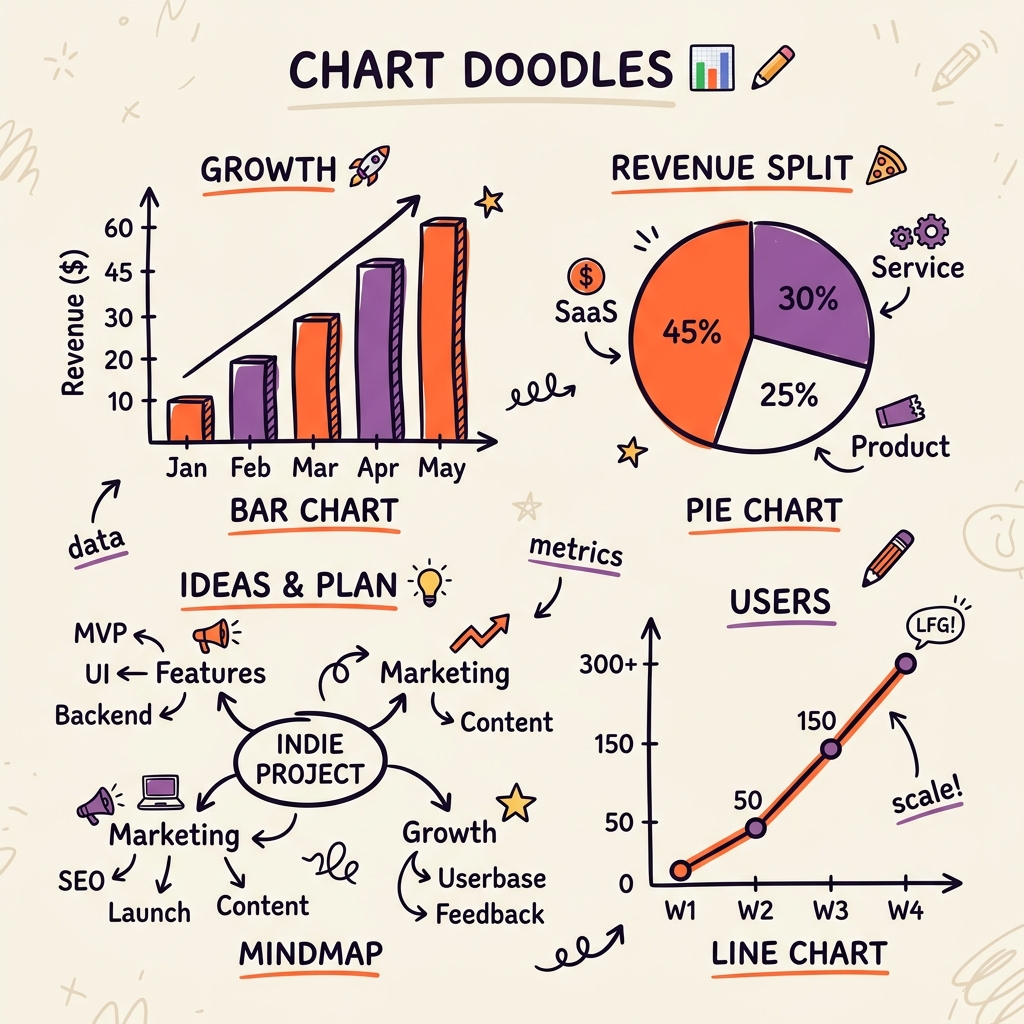
The bar chart vs pie chart debate isn't really a debate among data visualization professionals — bars win for comparison almost every time, because the human eye reads length far more accurately than angle or area. Reserve pie charts for situations with two or three segments where the "majority share" message matters more than precise comparison. Know when to use a scatter plot by asking whether you're testing for correlation; if you're not looking for a relationship between two continuous variables, a scatter plot adds complexity without adding insight.
Choosing Charts for Different Tools and Contexts
Chart selection also depends on where the visualization will live. In Datawrapper, bar and line charts render cleanly with minimal styling effort, making it the fastest path for journalism-style data visualization. In Tableau or Power BI, more complex chart types like heat maps and treemaps become practical because the tools handle the underlying calculations automatically — building those by hand in Canva or Illustrator is far more time-consuming.
For presentation slides specifically, simpler is almost always better. A scatter plot with forty data points might work beautifully on a static web page where readers can zoom in, but the same chart shown for ten seconds on a projector screen will lose most of its audience. When designing for PowerPoint or Google Slides, favor bar charts, simple line charts, and big single-number callouts over dense chart types — the viewing context changes which chart type actually communicates.
One context-specific exception worth noting: dashboards built for ongoing monitoring (KPI tracking, analytics overviews) benefit from sparklines and small multiples — compact line charts repeated across categories — since the goal is quick pattern-scanning rather than one-time storytelling.
A Chart Type Selector You Can Actually Use
When in doubt, work through this decision order rather than scanning a giant reference chart:
* Comparing categories? Use a bar chart, sorted by value rather than alphabetically, since sorted bars let readers spot the highest and lowest values instantly.
* Showing change over time? Use a line chart for continuous time series, or a bar chart if you only have a handful of discrete time periods (quarterly results, for example).
* Showing parts of a whole? Use a pie chart only with 2–4 segments, or switch to a simple bar chart once you have more categories than that.
* Showing relationship between variables? Use a scatter plot, and add a trend line only if the correlation is genuinely strong enough to support one.
* Showing geographic data? Use a choropleth map rather than forcing location data into a bar chart with place names as labels.
This decision order resolves the vast majority of data visualization types chart guide questions people search for, because most chart confusion comes from skipping straight to a familiar chart type instead of starting with the data relationship.
Once you've matched your data to the right chart family, the remaining decisions — color, labeling, annotation — become much easier, because the structure is already doing the heavy communicative lifting. See our Color Palette Generator for guidance on the next step once your chart type is locked in.
Frequently Asked Questions
What is the best chart type for comparing data?
A bar chart is the best chart type for comparing values across categories, since the human eye reads bar length more accurately than angles or areas. Sort bars by value rather than alphabetically so the highest and lowest results are immediately visible to readers.
When should I use a pie chart instead of a bar chart?
Use a pie chart only when showing two to four segments of a single whole, where the "majority share" message matters more than precise comparison. Once you have more than four or five categories, a sorted bar chart communicates the same data far more clearly.
What chart type shows the relationship between two variables?
A scatter plot is the standard chart type for showing the relationship, or correlation, between two continuous numeric variables. Add a trend line only when the correlation is strong enough to support one — a weak trend line can mislead readers into seeing a pattern that isn't really there.
What is the difference between a line chart and a bar chart?
A line chart works best for continuous data changing over time, like daily stock prices or monthly temperatures. A bar chart works better when you have discrete, separate categories to compare, even if those categories happen to represent different time periods, like quarterly sales totals.
How many chart types should an infographic use?
Most well-designed infographics use no more than two or three chart types total, since mixing too many visual formats forces readers to relearn how to read the data with each new chart. Consistency in chart type and color palette across an infographic improves both readability and retention.