Learning how to make an infographic from scratch feels harder than it should be, mostly because most tutorials jump straight to software clicks before explaining the thinking behind a good layout. You end up with a Canva template stuffed with your data instead of a design that actually communicates anything. The real skill isn't dragging icons around — it's deciding what story your numbers are telling before you touch a design tool. This guide walks through that process from blank page to finished, shareable graphic.
Why Most First Infographics Fail
The most common mistake happens before any design work starts: people open an infographic maker and start placing elements without deciding what the single takeaway should be. An infographic with five competing messages reads as visual noise, not information.
Before opening any tool, write one sentence that captures the entire point — "Remote work increased commute-free hours by 30% on average" — and let every visual decision serve that sentence. If a chart, icon, or paragraph doesn't support it, cut it. This single discipline separates infographics people actually share from ones that get scrolled past. It also makes the next steps faster, since you're no longer guessing what deserves visual weight and what doesn't.
The Step-by-Step Process
Once you know your core message, the actual build follows a predictable sequence:
1. Outline your content hierarchy. List your data points in order of importance, not the order you collected them. The most surprising or valuable stat goes first.
2. Sketch the layout on paper first. Decide whether this is a vertical list-style infographic, a comparison layout, or a single-stat hero design. Five minutes of sketching saves an hour of rearranging in software.
3. Choose your infographic maker. Canva offers the fastest path with a large free infographic template library; Figma gives more control if you want custom grids; Adobe Illustrator suits anyone needing print-ready vector output.
4. Build your grid first, content second. Set consistent margins and column widths before adding any text or icons — this single habit is what makes amateur infographics look professional.
5. Add data visualization elements last. Charts, icons, and illustrations should slot into the structure you've already built, not define it.
Following this order — message, sketch, grid, content — is what separates infographic design that looks intentional from a template with your numbers pasted in.
Layout, Color, and Tool-Specific Considerations
Layout choice depends entirely on what your data is doing. Sequential information (a process, a timeline) wants a vertical flow with directional cues like arrows or connecting lines. Comparative data wants a side-by-side or table-based layout. A single dramatic statistic deserves a hero treatment — one huge number, minimal supporting text, maximum visual impact.
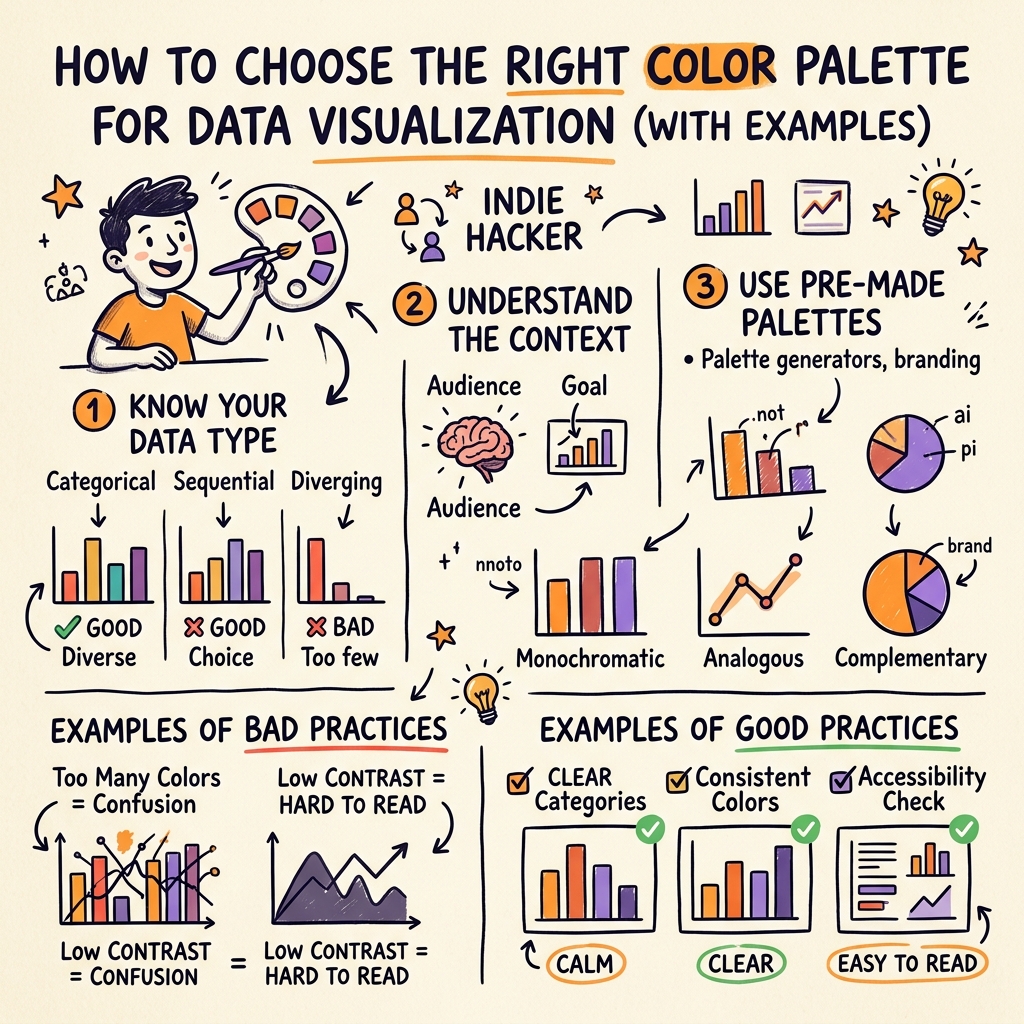
Color matters more than most first-time designers expect. Stick to one primary color plus a single accent for emphasis; resist the urge to color-code every section differently just because you can. In Canva, the brand kit feature lets you lock a palette across the whole design, which keeps consistency easy even mid-project. In Figma, set up color styles before you start so every element pulls from the same source.
One tool-specific note: Canva's AI-powered "Magic Switch" feature, expanded significantly since 2024, can now resize a finished infographic across formats automatically — useful once your design is locked, but don't rely on it for initial layout decisions, since it optimizes existing content rather than rethinking hierarchy.
Common Mistakes That Undermine Good Infographics
Even well-researched infographics get undermined by a handful of repeat offenders. Too many fonts is the most visible one — two typefaces maximum, one for headers and one for body text, is the safe ceiling. Overcrowded icon usage is another: icons should clarify a category at a glance, not decorate empty space, and using more than one icon style in a single design instantly looks unfinished.
Low contrast text is the silent killer of infographic engagement — light gray text on a white background might look elegant on your screen but becomes unreadable once compressed for social media. Test your design at thumbnail size before finalizing; if you can't read the headline stat at a glance, neither can your audience.
Finally, skipping a source citation undermines credibility instantly. A small "(Source: [name], 2026)" line costs nothing and signals the data is trustworthy.
Once your draft feels complete, the real test is sharing it with someone unfamiliar with the topic and asking what they remember thirty seconds later. If they can repeat your core message, the design worked. See our Chart Types Guide for help choosing the right visualization for your specific data before you finalize layout.
Frequently Asked Questions
What is the best free tool to make an infographic?
Canva is the best free infographic maker for most beginners, offering hundreds of free infographic templates, a drag-and-drop editor, and a built-in brand kit. Figma is a strong free alternative if you want more layout control or plan to collaborate with a design team.
How long does it take to make an infographic from scratch?
A simple single-stat infographic can take 30–60 minutes once you have your data ready. A more complex multi-section infographic, including sketching the layout and refining color and typography, typically takes 2–4 hours for someone comfortable with basic design tools.
What size should an infographic be?
Standard vertical infographics are usually 800 × 2000px for blogs and websites, while Instagram-optimized versions run 1080 × 1350px. Pinterest infographics perform best at a 2:3 ratio, such as 1000 × 1500px, since taller pins get more visibility in feeds.
Do I need design experience to make a good infographic?
No — following a structured process matters more than design training. Start with a clear single message, use a free infographic template as your grid foundation, and limit yourself to two fonts and one accent color to avoid the most common beginner mistakes.
How do I make an infographic look professional instead of cluttered?
Limit your design to one core message, two fonts, and a maximum of three colors. Build your layout grid before adding any content, and leave generous white space between sections rather than filling every inch — professional infographic design relies as much on what's left out as what's included.