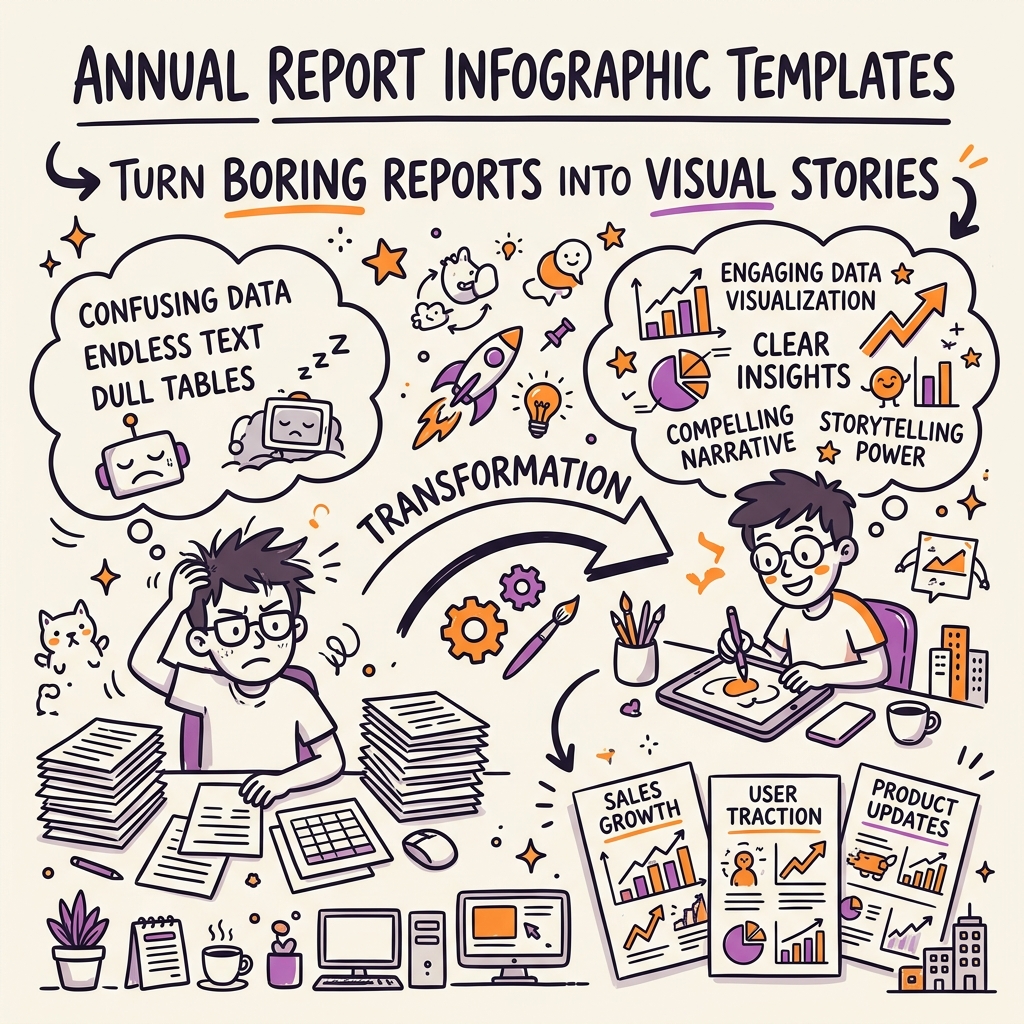
An annual report infographic template does something a 60-page PDF never will — it gets read. Most annual reports are treated like tax returns: mandatory, opened once, filed. The infographic version treats every page as a slide, every metric as a story, and every reader as someone with fifteen seconds to decide whether to keep scrolling. If your CFO handed you a wall of numbers and said "make this shareable," this guide walks through the layouts, page structures, and free downloads that turn a compliance document into a marketing asset.
Why Traditional Annual Reports Fail Everyone Who Reads Them
Traditional annual report design fails on two counts. It buries the numbers that matter under the numbers regulators require, and it treats visual design as decoration applied after the writing is done. The result is a document that satisfies auditors and no one else.
The infographic version flips the priority. It starts with the three or four figures the reader actually cares about — revenue growth, headcount, geographic reach, impact metrics — and gives each one a dedicated page. The regulatory tables still exist; they move to an appendix or a linked PDF. What replaces them on the front pages is a visual argument: here's what we did, here's what it means, here's what's next.
The shift matters commercially. A report that gets read gets shared. A report that gets shared reaches investors, journalists, and hires who would have never opened the compliance version. That's the return on treating an annual report as a designed communication rather than a legal document. It's why every major nonprofit — and increasingly every mid-market SaaS company — now ships an infographic-first version alongside the traditional one.
Six Pages Every Annual Report Infographic Template Should Include
A strong annual report infographic template gives you a repeatable page architecture that scales from a five-page nonprofit summary to a twenty-page corporate visual report. The structure below adapts across industries — the specific metrics change, the page types don't:
1. The cover. One headline figure or theme. "$4.2M raised for coastal cleanup." Not a stock photo of a boardroom. The number does the work.
2. The year at a glance. A single spread with 4–6 hero stats. Set each number huge; keep the labels short. This is the page that gets screenshotted.
3. The financial page. One clean chart showing revenue or spend by category, plus a plain-English caption explaining what shifted and why. Skip the pie chart of expense categories; use a treemap or stacked bar.
4. The impact or growth page. A visual timeline or map. If you added offices, show the geography. If you launched products, show the sequence.
5. The people page. Team stats, hiring growth, or donor breakdown — whichever tells the human story. Avoid stock team photos; use silhouettes with numbers instead.
6. The look-ahead. One page, three priorities for next year. Sets the reader up for the next report.
Every good annual report infographic template ships with these six page structures pre-built, so you swap in your own data without redesigning the layout. Canva's "Annual Report" template category and Venngage's nonprofit-focused designs both cover this structure. For a fully editable Figma version, browse the Templates section.
Corporate Reports Versus Nonprofit Reports: What Changes
A corporate infographic annual report and a nonprofit annual report share the same skeleton but land differently. Corporate reports emphasize growth: revenue up, headcount up, markets entered. Nonprofit reports emphasize impact: meals served, wells drilled, students taught. The design should follow the emphasis.
For corporate reports, the hero page usually leads with a growth metric — YoY revenue, ARR, or market share — set against last year's number for immediate comparison. The financial page carries more weight; investors and analysts will read the ratios. Use clean bar charts, avoid decorative flourishes, and keep the palette tied to brand.
For nonprofit reports, the hero page leads with an outcome — number of lives changed, dollars deployed, communities served. The financial page is still there, but the spending breakdown often gets stronger visual treatment (donors want to see program-to-overhead ratios). Photography and human stories play a larger role. Icons can carry more weight than they do in a corporate deck.
Both benefit from a report template free of stock imagery clichés. The number that matters most should be the biggest thing on the page. The rest is context, not competition.
Where to Find a Report Template Free and What to Watch For
Four sources cover most needs. Canva's annual report category has the widest range and easiest editing — the free tier works for most nonprofits under 250 pages a year. Venngage focuses on data-heavy reports and offers a free tier with export limits. Piktochart's nonprofit templates lean heavily on impact visualization. For designer-owned files, Envato Elements and Adobe Stock have paid annual report infographic template libraries that ship as editable InDesign or Illustrator files.
Two things to check before you commit. First, brand controls — can you swap fonts and colors globally, or does the template lock you into its palette? Second, export formats — you'll want PDF for the compliance version and a high-resolution PNG or Instagram-ready crop for social distribution. If the template doesn't handle both, keep looking. The right template earns its cost back the first time you don't have to rebuild the page structure from scratch.
The Report Worth Making
An annual report infographic template turns the report that had to exist into the report you want people to read. Pick a structure that fits your story — six pages, hero metrics, one visual argument per spread — and let the template handle the pixel decisions. The 2026 shift toward interactive, web-native reports builds on this same skeleton, not against it. Browse the Examples Gallery for finished reports worth studying before you start yours.
Frequently Asked Questions
What is an annual report infographic template?
An annual report infographic template is a pre-designed multi-page layout for turning a company's yearly performance data into a visual, scannable document. It typically includes a cover, a year-at-a-glance page, financial visualization, impact or growth pages, and a look-ahead section. Templates handle the layout and typography so you focus on which numbers to feature and how to caption them.
How long should an annual report infographic be?
Five to twenty pages, depending on audience. A nonprofit donor summary works well at 5–8 pages. A corporate visual report for shareholders and press typically runs 12–20 pages. Anything over 20 pages should include a table of contents and page numbers, or split into a summary infographic plus a linked full report. Length rarely improves comprehension — hierarchy does.
Can I create an annual report infographic without a designer?
Yes. Canva, Venngage, and Piktochart all offer annual report infographic template libraries designed for non-designers, with drag-and-drop editing. If your report needs full brand customization or non-standard page sizes, a designer will save time. For most nonprofits and mid-market companies, a template plus a marketing hire with taste is enough to ship something professional.
What data should I include in a corporate infographic annual report?
Focus on the four to six numbers that tell your growth story: revenue or ARR, year-over-year growth rate, headcount, geographic or market expansion, product launches, and one signature impact metric. Avoid dumping the full financial statements into the infographic — link out to the compliance PDF for that. Every number on an infographic page should earn its place.
Are free annual report templates good enough for professional use?
For most organizations, yes. Free tiers of Canva and Venngage produce polished, on-brand results if you enforce your own color palette and swap in real photography. The limits usually show up in export resolution, watermarks, or restricted premium fonts — all fixable with a $15/month upgrade if you outgrow the free tier. Start free, upgrade only when you hit a wall.