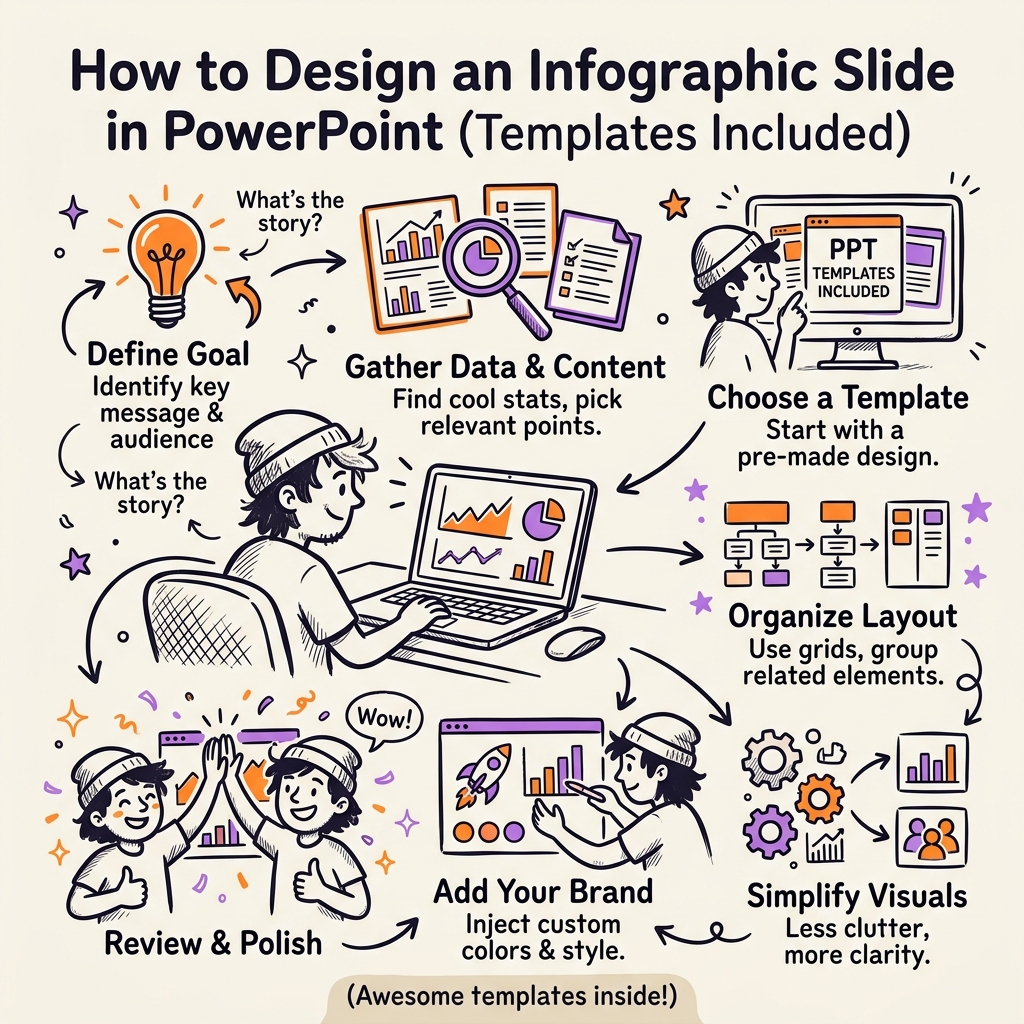
Designing an infographic slide in PowerPoint is one of the most searched tasks in presentation design — and one of the most frustrating to get right without a clear process. The tools are all there: shapes, icons, SmartArt, charts, text boxes. The problem is that they're also the ingredients for creating an absolute mess. This guide walks you through the process from blank slide to finished PPT data visualization, with concrete slide design tips and the templates worth using.
Why PowerPoint Is Actually Good for Infographic Design
PowerPoint gets unfairly dismissed as a design tool. The truth is that for infographic slides specifically, it's close to ideal — if you know how to use it.
The core advantage is constraint. Canva gives you infinite canvas; Figma gives you boundless artboards. PowerPoint gives you a fixed 16:9 rectangle and a finite set of tools. That constraint forces editorial decisions that improve designs. You can't keep adding — eventually the slide is full, and that forces prioritisation.
The second advantage is the ecosystem. Your audience almost certainly has PowerPoint. Your infographic slide can be shared, edited, and presented without any format conversion, app download, or compatibility headache. A beautiful Figma design that lands in a client's inbox as a flattened PNG has lost half its value.
The third is SmartArt and shape morphing, which most users never fully explore. SmartArt gives you pre-built relationship diagrams, cycles, hierarchies, and processes that are editable and rebrandable in minutes. Shape morphing lets you build animations that turn a static slide into a visual sequence.
For PPT data visualization specifically, the native chart engine — while not as elegant as Datawrapper or Flourish — is more than capable for bar, column, line, and scatter charts. Combined with careful annotation, it can produce publication-quality results.
How to Design an Infographic Slide in PowerPoint: Step by Step
Step 1 — Choose the right slide dimensions. Before you design anything, check your slide size. The default is 13.33 × 7.5 inches (33.87 × 19.05 cm) at standard 16:9. If you're designing for a vertical scroll or a printed handout, switch to a custom size under Design → Slide Size → Custom. Getting this wrong at the end means repositioning everything.
Step 2 — Define your layout grid. Go to View → Guides and add a horizontal and vertical guide at the center. Add two more vertical guides at about 0.5 inches from each edge to define your margins. This invisible grid will prevent the most common infographic slide failure: elements placed by eye that don't actually align.
Step 3 — Establish your color palette before you place a single element. Open Format Shape or Format Text and define your theme colors in Design → Variants → Colors → Customize Colors. Set your primary, secondary, and accent colors once. Every fill, border, and font color in your infographic slide should come from this palette — never from the default rainbow.
For a clean PPT data visualization, three to four colors is the ceiling. One dominant neutral (often white or a very light gray), one primary brand color, one accent for highlights, and a text color. More than that and the infographic stops communicating hierarchy and starts producing noise.
Step 4 — Build your structure with rectangles, not text boxes. The fastest way to make an infographic slide look designed rather than thrown together is to build the layout from filled rectangles first, then place text and data inside them. Start with a colored header band across the top, then divide the body into two or three columns using rectangles. Text boxes placed directly on a white slide always look like a document, not a design.
Step 5 — Use icons from PowerPoint's built-in icon library. Insert → Icons gives you access to Microsoft's icon library — several thousand flat, scalable SVG icons that inherit your theme colors. These are more useful than most designers realize. For an infographic slide covering process steps, statistics, or comparisons, a well-chosen icon does the heavy lifting that extra copy would otherwise require.
Step 6 — Add your data visualization as a native chart, not a screenshot. Insert → Chart and choose your type. For infographic slides, bar and column charts are the workhorses. Once inserted, right-click → Format Data Series to strip out gridlines, remove the legend (label the bars directly instead), and adjust the gap width. A gap width of 150–180% gives the chart room to breathe. Delete the chart border and set the plot area background to transparent so the chart sits flush with your slide layout.
Step 7 — Annotate directly on the visual. Add a text box over or beside the key data point. One line. Fourteen-point font. Whatever conclusion the number supports. This is the single most important slide design tip in this list — direct annotation eliminates the need for a legend and makes the data story immediate.
Step 8 — Align everything with the Align tool, not by eye. Select all elements in a section, go to Shape Format → Align → Align to Slide, then distribute them horizontally or vertically. Never guess at spacing. One misaligned element undermines the entire design.
PowerPoint Infographic Templates Worth Using
You don't have to start from scratch. Here are the categories of PowerPoint infographic template worth looking for — and what to check before using one.
Statistical infographic templates — these are designed around large numbers and percentage callouts. Look for ones that use a two or three-column layout with icon + number + label blocks. Avoid templates where every statistic gets a different color; choose ones that use a consistent palette with accent color used only for the headline figure.
Process infographic templates — ideal for step-by-step workflows. Look for numbered chevrons or connected circles with space for two to three lines of body text per step. Avoid templates with more than six steps on a single slide; beyond that, split across two slides or use a horizontal scrolling layout.
Comparison infographic templates — two-column side-by-side layouts. The best ones use color contrast (not just different icons) to make the two options visually distinct. A light background on one side, a dark background on the other, immediately signals "these are alternatives."
Timeline infographic templates — a horizontal timeline for four to six events is the sweet spot for a single slide. Anything beyond six events becomes unreadable unless you use a vertical scroll format.
When downloading a PowerPoint infographic template, always check: Does it use theme colors (meaning you can rebrand it in seconds via Design → Variants)? Are the icons grouped and editable, or are they flattened images? Is the font set using the theme fonts, or is it a custom font you'd need to install? Templates that pass all three checks save hours.
Slide Design Tips Specific to Infographic Slides
Limit yourself to two fonts. One for headlines (a geometric sans like Montserrat or your brand font), one for body copy (something legible at small sizes — Calibri actually works fine). Using three or more fonts is almost always the mark of an unfinished design.
Use white space as a design element. The instinct when building infographic slides is to fill every corner. Resist it. Empty space tells the reader where to look. A statistic floating in open white space lands harder than the same statistic surrounded by competing elements.
Make your numbers big. If the infographic is communicating a data point, that number should be the largest element in its section. Hierarchy is the most reliable tool in slide design — if everything is the same size, nothing is important.
Avoid gradients unless they're your brand identity. Gradients in infographic slides almost always look dated or amateurish compared to flat color blocks. The exception is a very subtle gradient in a background band used to add depth without visual noise.
Test it at thumbnail size. Before you call an infographic slide finished, zoom out to 50% and squint at it. Can you still read the headline number? Is the structure obvious? If not, increase the size of the most important element and reduce everything competing with it.
Frequently Asked Questions
How do I make an infographic slide in PowerPoint?
Start by setting your slide dimensions, then define a layout grid using PowerPoint's guide lines. Build the structure with filled rectangles before adding text or icons. Use native charts for any data visualization, annotate directly on charts instead of using legends, and align everything with the Align tool. Consistent use of a three-to-four color palette will unify the design.
What is a PowerPoint infographic template?
A PowerPoint infographic template is a pre-built slide layout with placeholder text, icons, and data visualization blocks already positioned and styled. Good templates use editable theme colors and fonts so you can rebrand them in minutes. They're best used as a structural starting point, not copied verbatim.
How do I add infographic elements in PowerPoint?
Use Insert → Icons for scalable flat icons, Insert → Chart for native data visualizations, Insert → SmartArt for process and relationship diagrams, and Insert → Shapes for layout building blocks. Combine these rather than importing images, so every element remains editable and color-matched to your theme.
What size should an infographic slide be in PowerPoint?
The standard 16:9 slide (13.33 × 7.5 inches) works for most presentation contexts. For a vertical infographic designed to be shared as a standalone image on LinkedIn or Instagram, switch to a custom size: 8.5 × 11 inches for a portrait layout, or 1080 × 1920px if you're exporting for Instagram Stories. Set this before you start designing.
What are the best slide design tips for PPT data visualization?
The most impactful tips: annotate your key data point directly on the chart instead of using a legend; use a maximum of four colors in your palette; set your numbers large enough to be read at a glance; align every element using PowerPoint's Align tool; and use one-sentence opinionated chart titles rather than descriptive ones. Each of these changes has more impact than any decorative element you might add.
Can I use PowerPoint for professional infographic design?
Yes — PowerPoint's grid system, native chart engine, built-in icon library, and SmartArt make it capable of producing professional infographic slides. The limitation is export quality: for print or high-resolution digital use, export as PNG at the highest resolution available (400 DPI via Save As → PNG) rather than relying on the default JPEG export. For motion-heavy infographics, Canva or Figma are better suited, but for presentation-native infographics, PowerPoint is hard to beat.