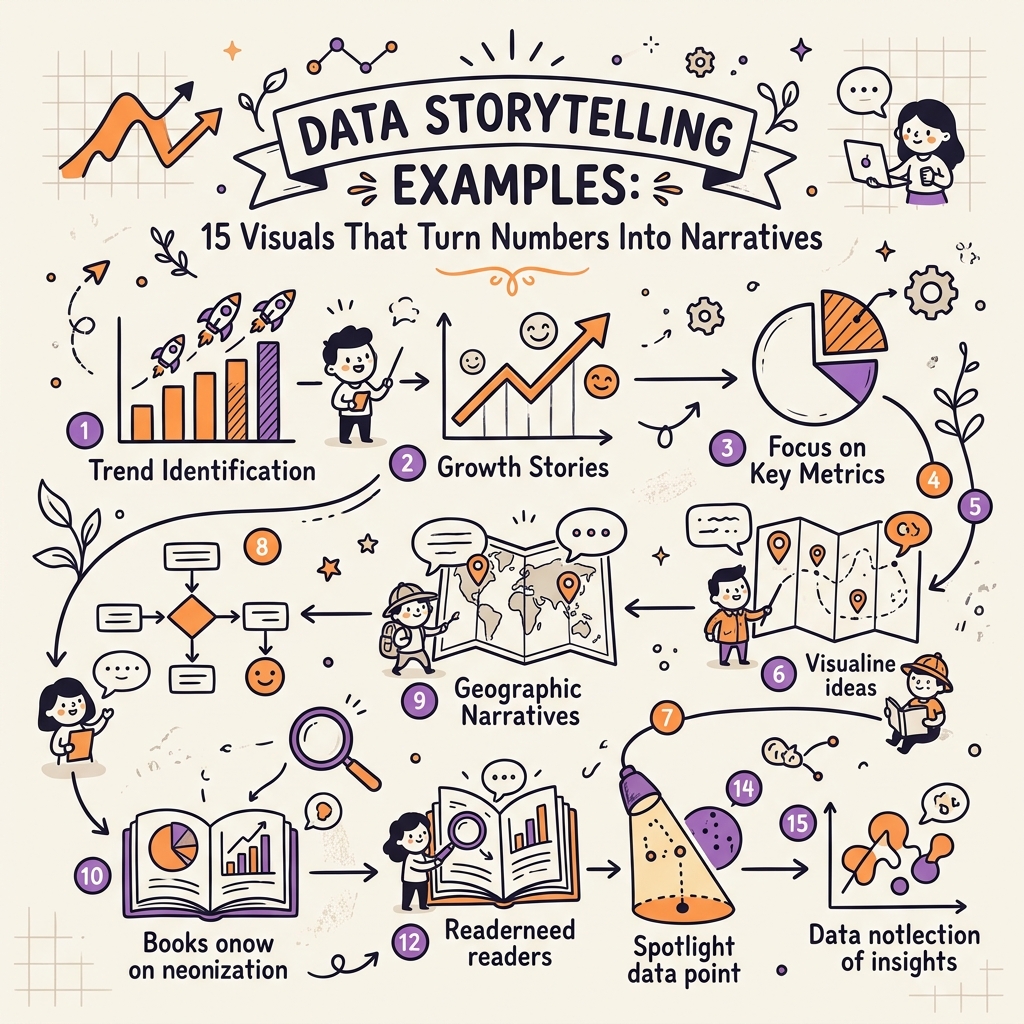
Data storytelling is what separates a chart that gets skipped from one that changes a room. When the numbers have a point of view — a beginning, a tension, a resolution — they stop being data and start being an argument. These 15 data storytelling examples break down exactly how the best designers and analysts do it, and what you can take into your next project today.
Why Data Storytelling Works Differently Than a Standard Chart
A standard chart answers a question. A data narrative tells you why the answer matters.
The brain processes visuals roughly 60,000 times faster than text, but that speed only helps if the visual is organised around a story structure. When it isn't — when a dashboard has 14 charts and no editorial hierarchy — the brain slows down, hunts for meaning, and usually gives up. Data storytelling solves this by front-loading context: here's what was happening, here's what changed, here's what you should think about it.
The best data narrative examples share three structural elements: a clear protagonist (the trend, the anomaly, the comparison), a moment of tension (the inflection point, the gap, the surprise), and a resolution (the insight the audience should walk away with). Strip any one of those out and you're back to a data display, not a story.
This applies whether you're building a single slide in PowerPoint, a scrollable editorial piece in Flourish, or a dashboard in Tableau. The medium changes. The story structure doesn't.
15 Data Storytelling Examples — And What Makes Each One Work
1. The COVID-19 Curve Flattening Chart (Johns Hopkins) A single line chart became the most-shared dataviz of 2020. What made it work: the annotation did all the heavy lifting. Instead of letting viewers interpret the line themselves, each policy intervention was marked directly on the curve. The story wrote itself — you could see exactly when restrictions were introduced and what happened next. Steal this: annotate your inflection points instead of relying on a legend.
2. The New York Times "How the Virus Got Out" Scrollytelling Piece A masterclass in the scrollytelling format — where the chart animates as you scroll down the page. Each scroll step revealed one new connection in a global flight network, building dread in the reader before the full picture landed. The pacing was editorial, not just technical. Steal this: think about the sequence in which your audience encounters your data, not just the final state.
3. Gapminder's Income vs. Life Expectancy Bubble Chart Hans Rosling's animated bubble chart reframed global development by letting the data move through time. Static charts couldn't show the story; the animation was the story. Countries that lagged in 1950 visibly closed the gap by 2000. Steal this: if your story is fundamentally about change over time, static charts are working against you.
4. The Economist's "Graphic Detail" Charts The Economist doesn't use a headline above its charts — it uses an opinionated title that tells you what to think before you read the chart. "Africa is getting richer, but not fast enough" is a story. "GDP growth in Sub-Saharan Africa, 2010–2024" is a label. Steal this: rename every chart title from a description to a conclusion.
5. FiveThirtyEight's Election Probability Needles The live probability needle during US elections is controversial for a reason: it makes the audience feel the uncertainty of the data, not just see it. The needle shook. Viewers felt anxious. That emotional transmission is the goal of storytelling with charts. Steal this: don't hide uncertainty — find a way to make your audience feel the error bars.
6. The "You Draw It" Interactive (NYT) By asking readers to draw the trend themselves before revealing the actual data, the Times created genuine surprise and cognitive commitment. People were more engaged with the revelation because they had skin in the game. Steal this: when your data is counterintuitive, give the audience a moment to commit to an expectation before you correct it.
7. A Single Annotated Bar Chart for Business Data Presentation Not every powerful business data presentation needs to be elaborate. One agency shared a bar chart showing quarterly revenue — but one bar was red, and a single annotation read "Client X churned in Q3." The whole story in one chart, one color deviation, one line of text. Steal this: resist the urge to add more. The story is often in the single exception.
8. Flowing Data's "A Day in the Life" Small Multiples Nathan Yau's time-use visualizations use small multiples — dozens of tiny charts shown side by side — to show population-level patterns in how Americans spend their time. No single chart is remarkable. The collection is astonishing. Steal this: if you have consistent comparisons across many subjects, small multiples outperform a single busy chart every time.
9. The "1 in 6" Public Health Infographic Public health campaigns learned early that percentages don't move people — concrete individuals do. "1 in 6 Americans experiences food insecurity" hits harder as a single figure isolated on the page than as a slice of a pie chart. The data narrative here is a single number, treated like a character. Steal this: isolate the number that should land. Give it space. Let it breathe.
10. Spotify Wrapped's Personal Data Story Spotify turned user analytics into a cultural moment by making the data about the person reading it. Your top song. Your most-listened artist. Your listening personality. The data hasn't changed — it's the same play counts any streaming service tracks — but the framing as a personal narrative made it something people screenshot and share. Steal this: whenever possible, make the data about the audience, not about the subject.
11. Bloomberg's Climate Spiral A circular animation showing rising global temperatures since 1880 was designed to be viscerally alarming — and it was. The circular format, building outward year by year, was chosen because it made the acceleration visible in a way a line chart couldn't. Steal this: the right chart type for a data narrative is the one that makes the story physically unavoidable.
12. The "Gun Deaths in America" Interrupted Bar Chart (Periscopic) Instead of showing statistics, this piece showed each gun death as an arc representing a life cut short — the trajectory from birth to average life expectancy, interrupted. It's one of the most cited examples of emotional data design. Steal this: ask yourself whether the visual metaphor you're using maps to the emotional weight of the data.
13. A Before/After Slide for a Sales Deck In a high-stakes pitch deck, one slide showed two simple column charts side by side: before the product, after the product. No commentary. No legend. Just two distributions, visually transformed. The story was self-evident. Steal this: comparison is narrative. Before/after, with/without, us/them — these structures do storytelling work without requiring prose.
14. The "Dollar Street" Photo-Data Hybrid Anna Rosling Rönnlund's project matched income data to photographs of homes around the world. The data point became a front door, a kitchen shelf, a child's toy. This is data storytelling in its most literal form: anchoring abstract numbers to human reality. Steal this: if your data is about people, find the image that makes the number tangible.
15. A Simple Slope Chart for Executive Reporting A slope chart — two data points per series, one for now and one for before — is one of the most underused charts in business data presentation. It shows change, rank, and relative magnitude simultaneously. A marketing team used one to show that their brand ranked fifth in awareness but first in purchase intent. That gap was the story. Steal this: sometimes the most powerful data narrative lives in the gap between two numbers.
How to Apply These Techniques in Your Own Tools
Most of these principles are tool-agnostic, but execution varies. In Canva, the easiest win is the annotated title — rename your chart text to a conclusion and place a single callout box on the key data point. In Flourish, the scrollytelling and animated chart formats are built-in; the editorial decisions are yours to make. In Datawrapper, annotation layers are their core strength — use them aggressively. In PowerPoint or Google Slides, the before/after comparison and the isolated single number are your most reliable storytelling moves.
The most common mistake is confusing completeness with clarity. A chart that shows everything is usually a chart that communicates nothing. Data narrative design is an act of editorial courage: you have to decide what the story is and then cut everything that contradicts or dilutes it.
Common Mistakes That Kill the Story
Including too many data series is the fastest way to lose the narrative thread. If a reader has to work out which line to follow, you've lost them. Choose your protagonist — the trend, the outlier, the comparison — and subordinate everything else to it.
Relying on the legend is the second most common failure. Legends force the reader's eye to travel back and forth between the chart and the key. Label directly wherever possible; it keeps the story intact.
Starting with data instead of context is the third. Your audience doesn't know why your Q3 number matters. Tell them what it should have been first, then show them what it was. The gap is the story.
The best data storytelling examples in this list share a bias toward simplicity — not because the underlying data is simple, but because clarity is a design decision, not an accident.
Frequently Asked Questions
What is data storytelling?
Data storytelling is the practice of combining data, visuals, and narrative structure to communicate insights in a way that is memorable and persuasive. It goes beyond displaying numbers by giving them context, sequence, and emotional resonance — turning a chart into a point of view.
What are the best data storytelling examples for business?
For business contexts, the most effective examples tend to be annotated bar charts with a single callout, before/after slope charts, and single-number isolation on a slide. These formats work because they give executives a conclusion, not a data dump. The goal is insight delivery, not data display.
How is storytelling with charts different from regular data visualization?
Regular data visualization presents information accurately. Storytelling with charts uses visual design to guide the reader to a specific insight — through annotation, sequencing, color contrast, and editorial titling. The data might be identical; the story is a deliberate design choice layered on top.
What tools are best for creating data narratives?
Flourish and Datawrapper are the strongest dedicated tools for data narrative, particularly for scrollytelling and annotated charts. For presentation contexts, PowerPoint and Canva work well for static narrative frames. Tableau and Power BI handle complex live data but require more intentional editorial design to produce genuine storytelling rather than dashboards.
How do I make my data presentation tell a story?
Start by writing the headline you want your audience to remember — one sentence, one conclusion. Then build your visual backward from that headline. Every design decision (chart type, color, annotation, order) should serve that conclusion. If a data series doesn't support the story, don't include it.
How long should a data story be?
A data story can be a single annotated chart or a 20-slide scrollable editorial piece — the length depends on the audience and context. For executive presentations, shorter is almost always better. For editorial or public-facing content, longer formats with sequenced reveals tend to drive higher engagement and sharing.