A timeline infographic template has one job: make sequence feel obvious before the reader reads a single word. If someone has to scan back and forth to figure out what came first, the design has failed — no matter how polished it looks. The right template gives you a clear directional structure, consistent spacing logic, and enough visual breathing room that 10 events don't feel like 40. This guide covers 20 free, editable timeline designs organized by use case, plus the layout decisions that determine whether your timeline actually communicates or just decorates.
What Makes a Timeline Infographic Template Worth Using
Most free timeline templates fall into one of two failure modes: they're so minimal they feel unfinished, or they're so decorated they obscure the actual sequence. A usable template threads between those two extremes. It has a strong directional anchor — a horizontal line, a vertical spine, or a clear left-to-right flow — that tells the eye where to start and where to go. It uses consistent visual markers for each event: a dot, a flag, or an icon. And it keeps the text area per event genuinely small, because a timeline that needs paragraphs to explain each point is a timeline that should probably be a different format entirely.
A chronological infographic earns its format when sequence and pacing are the point. A company hitting five funding milestones over three years, a product roadmap moving through four development phases, a historical event unfolding across a decade — these are timeline stories. A list of ten unrelated facts about a topic is not, no matter how well you lay it out on a timeline spine.
Before you open a template, answer two questions: How many events? And does the time gap between events matter to the story? The answers determine layout. Five to eight events on a horizontal template reads cleanly on one slide. Twelve to twenty events needs a vertical scroll or a spiral. And if the gap between events matters — "nothing happened for eight months, then everything changed" — you'll need a proportionally spaced template rather than one that distributes events evenly regardless of real elapsed time.
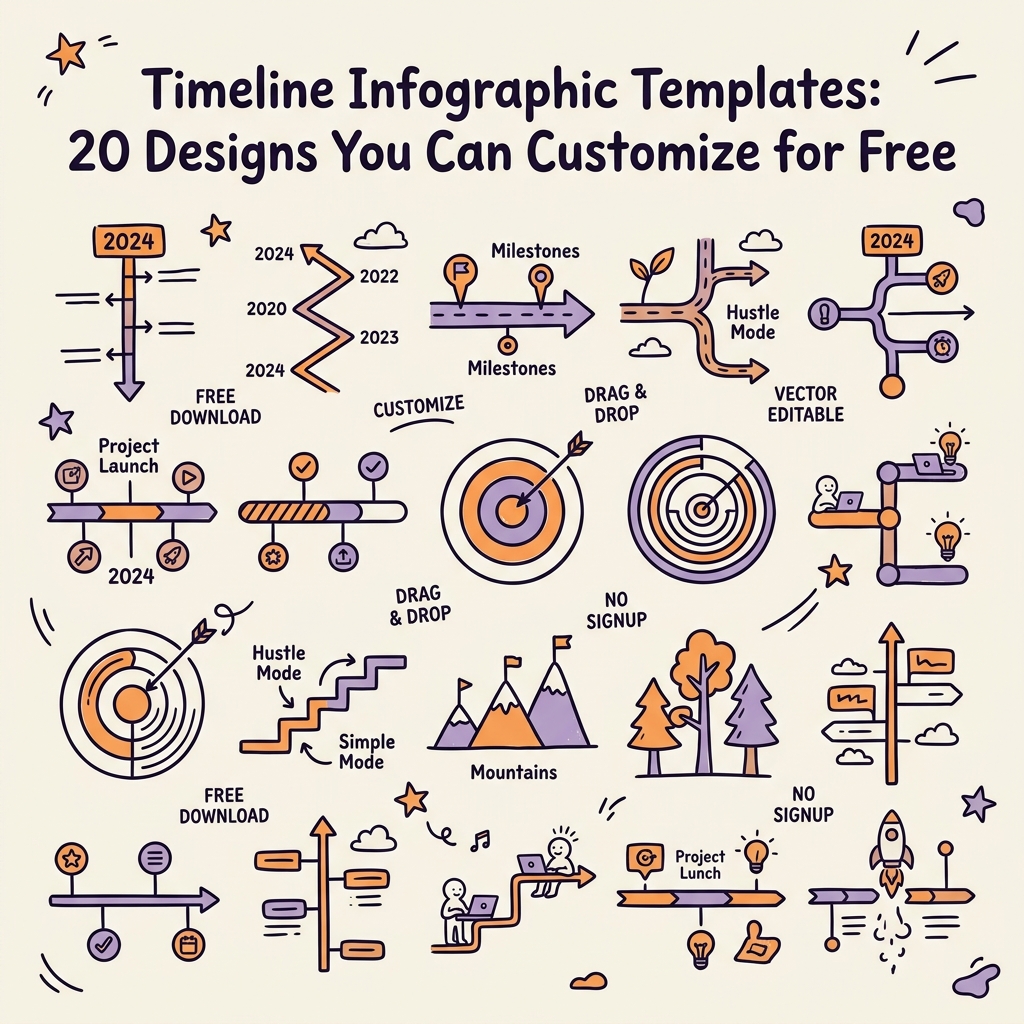
Twenty Free Timeline Templates by Use Case
These templates span the major layout types and use cases, organized so you can find the right fit by what you're actually making rather than by what the design looks like in a thumbnail.
Horizontal milestone timelines (5 templates): These read left to right along a single line, with event markers above or below the spine. Best for project timelines with four to eight milestones — a product launch roadmap, a hiring process overview, a client onboarding journey. Canva's "Project Roadmap" and "Horizontal Milestone Timeline" templates are two of the cleanest free options here as of 2026, particularly because they use vector icons that resize without blurring when you swap your own in.
Vertical scrolling timelines (4 templates): Events stack top to bottom with dates on one side and descriptions on the other. This layout suits company history pages, long-form annual report sections, and any timeline that needs more than ten events and will live on a webpage or be read at a reader's own pace. Visme offers four strong vertical templates in its free tier, including one with alternating left-right event placement that works well when descriptions are longer than a single line.
Spiral and curved timelines (3 templates): Events follow a curved or spiral path, fitting a high event count into a compact square or portrait format. These are common in annual reports, print inserts, and infographic-heavy blog posts. They look complex but they're built on simple grids — Canva's "Circular Timeline" template and Piktochart's "Spiral History" template are both fully editable and take about fifteen minutes to customize once you understand the layout logic.
Dual-track timelines (3 templates): Two parallel horizontal or vertical lines run simultaneously — one for internal milestones, one for customer-facing events, for example, or one for a before-state and one for an after-state. These work well for project retrospectives, competitive history comparisons, and any "our journey vs. the industry" narrative. Visme has two dual-track templates that use color-coded spines to keep the tracks visually distinct without adding clutter.
Gantt-style timeline templates (3 templates): These blend a project timeline visual with duration bars — tasks are shown as bars spanning their full start-to-end range rather than as single event dots. Use these when tasks overlap, when showing parallel workstreams matters, or when a client or stakeholder needs to see schedule dependencies at a glance. In Canva, search "project plan timeline" rather than "Gantt chart" to find the templates that render cleanly as infographics rather than spreadsheet-style grids.
Infographic timeline for presentations (2 templates): Single-slide horizontal designs optimized for 16:9 widescreen ratio, designed to drop directly into a PowerPoint or Google Slides deck. These are the narrowest and most constrained format — usually four to six events maximum — but they're the most useful for the common case of needing a visual timeline summary inside a larger slide deck rather than as a standalone document.
Customizing a Timeline Template Without Breaking Its Layout Logic
The most common customization mistake is adding more events than the template's spacing was designed to hold. A horizontal template built for six milestones usually has node spacing and text area sizing calibrated for six — squeeze ten events in and you'll end up shrinking the text, compressing the spacing, and destroying the visual hierarchy that made the template work in the first place.
The fix: treat the event count as a layout constraint, not a number to push against. If you have ten events and a horizontal template built for six, either trim to the six most important events, switch to a vertical or spiral layout, or split the timeline into two phases shown as separate infographic panels.
When you're editing inside Canva, use grouped objects rather than ungrouping and moving elements individually — the template's internal spacing logic lives in those groups, and ungrouping breaks it. In Figma, editable timeline templates from the community files usually have auto-layout frames built in, which means adding a new event automatically adjusts spacing for the rest. That's worth seeking out if your timeline will need to iterate.
For any timeline that needs to update regularly — a living product roadmap, a quarterly milestone tracker — avoid static design tools entirely and use Datawrapper's timeline chart or a linked Google Sheets chart instead. The time you save rebuilding the visual every quarter more than makes up for the slight reduction in design control.
The Detail Almost Every Free Template Gets Wrong
Evenly distributed event spacing is the default behavior of virtually every free timeline infographic template, and it's almost always wrong. Equal spacing implies equal elapsed time between events. If your timeline shows a company's first funding round in 2018, its second in 2019, and its third in 2023 — four years of silence between the second and third milestones — spacing all three events equally rewrites history.
When real time gaps are meaningful to your story, use proportional spacing. Position events based on their actual dates, letting long gaps show as visual white space and close clusters show as tight groupings. This requires manual adjustment in Canva or Figma, since neither tool handles proportional spacing automatically, but the resulting timeline tells a truthful story instead of a visually convenient one.
When the gaps genuinely aren't meaningful — you're just showing a process with sequential steps — even spacing is fine and usually cleaner. The key is deciding which situation you're in before you start, not discovering it after you've placed all your event nodes.
Download our free [Timeline Design Checklist] from the Templates section to work through spacing, event count, and layout choices before you pick a template, and browse the [Examples Gallery] to see how proportional spacing changes the story a timeline tells.
A good timeline infographic template is a starting point, not a finish line. The layout gives you the structure; the decisions you make inside it — what to include, how to space it, what to annotate — determine whether it communicates or just looks like it does.
Frequently Asked Questions
What is the best free timeline infographic template?
The best free timeline infographic template depends on your event count and format. For four to eight events on a single slide, Canva's horizontal milestone templates are the most polished free option as of 2026. For ten or more events in a scrollable format, Visme's vertical timeline templates give you more room per event without compressing the layout.
How do I make a timeline infographic in Canva?
Search "timeline" in Canva's template library, filter by your layout preference — horizontal for slides, vertical for longer content — then replace the placeholder dates, icons, and event descriptions with your own. Keep grouped objects intact rather than ungrouping, since Canva's timeline templates build their spacing logic into the grouped elements.
Should a timeline infographic be horizontal or vertical?
Use horizontal for four to eight events on a single slide or page, since the left-to-right reading direction feels natural for short sequences. Use vertical for ten or more events, for content that lives on a webpage where scrolling is expected, or when event descriptions are more than one to two lines long and need more horizontal space to breathe.
How many events can a timeline infographic hold?
A horizontal timeline holds four to eight events clearly before spacing and readability suffer. A vertical layout handles ten to twenty events comfortably. A spiral layout can accommodate more than twenty events in a compact format but requires more design skill to execute clearly. As a general rule, every event you add makes every other event slightly harder to notice.
What's the difference between a timeline infographic and a Gantt chart?
A timeline infographic marks discrete events at specific points in time — a launch, a milestone, a historical moment. A Gantt chart shows tasks with durations, start dates, and end dates, often with overlapping bars that represent parallel workstreams. Use an infographic timeline when events are the point; use a Gantt-style template when durations and scheduling dependencies are the point.
Can I use a timeline template for a PowerPoint presentation?
Yes — look specifically for templates sized at 1920 × 1080px or labeled as "presentation timeline" in Canva or Visme. These drop into a PowerPoint or Google Slides deck as a single slide image. Keep events to four to six maximum for a presentation context, since anything denser becomes unreadable from a projector distance.