Knowing how to present data in a presentation is a different skill from knowing how to analyze it — and most people only practice one of them. You can spend three days in Excel building a flawless dataset, then lose the room in thirty seconds because the chart is cluttered, the point is buried, or the slide is doing too much at once. Data storytelling is what bridges the gap between insight and impact. This guide breaks down twelve techniques that work, drawn from the real decisions that separate slides people remember from slides people politely sit through.
Why Your Data Slides Are Probably Losing People (And How to Fix It)
The most common data slide failure isn't a bad chart type. It's a missing argument. A chart answers "what happened" — but a presentation slide needs to answer "so what?" When you drop a raw chart onto a slide without editorializing it, you're asking the audience to do your analytical work for you in real time, while you're talking.
The fix is simpler than most people expect: write the conclusion as the slide title. Not "Q3 Revenue" but "Revenue grew 22% — driven entirely by the enterprise segment." Not "Customer Satisfaction Scores" but "Satisfaction dropped after the April update and hasn't recovered." When the title is the argument and the chart is the evidence, the slide has a point of view, and audiences follow points of view.
This is the foundation that everything else in presentation data visualization builds on. Every technique below only works if the slide already knows what it's trying to prove.
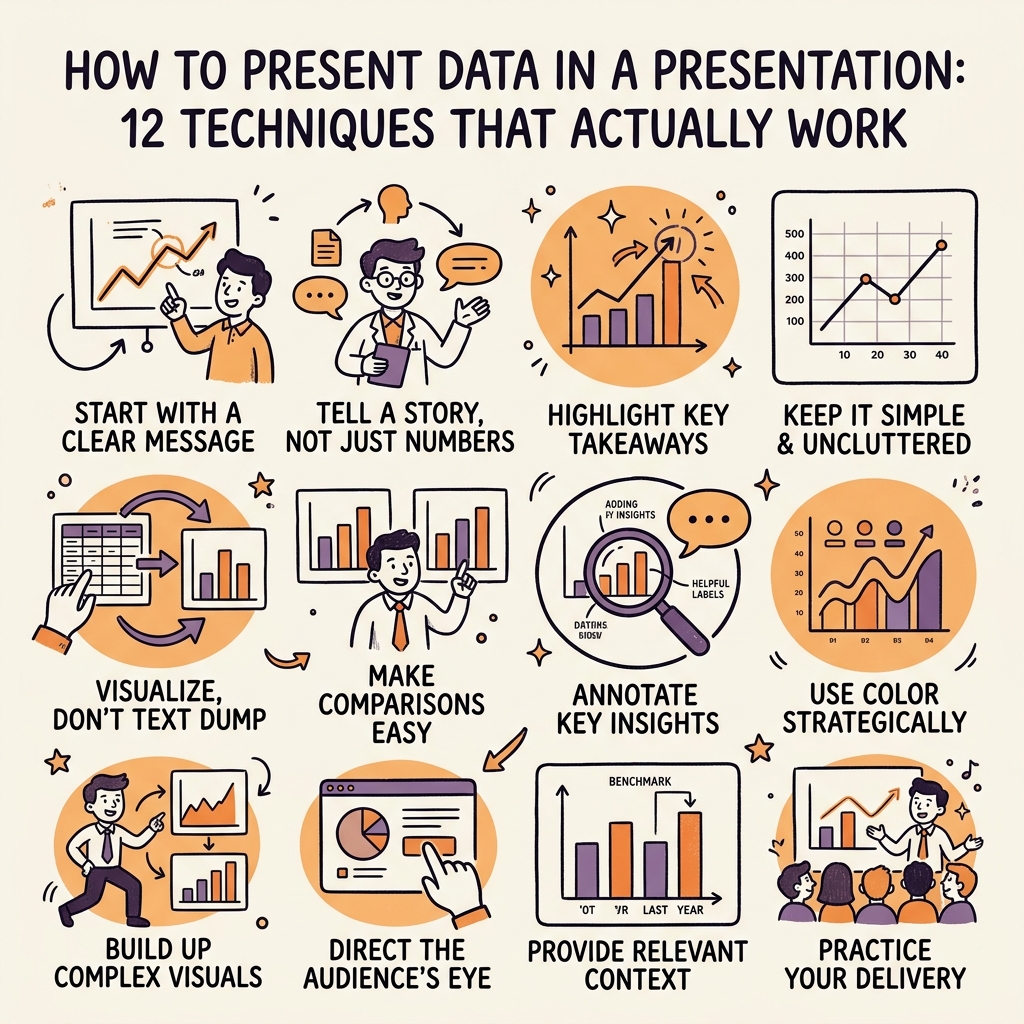
12 Techniques for Presenting Data Clearly and Memorably
These techniques are ordered by where they happen in your workflow — from structural decisions you make before you open a design tool, to visual choices you make inside it.
1. One slide, one idea. If a slide needs a sub-bullet to make sense, it's two slides. Split without guilt. Audiences don't complain about too many slides; they complain about confusion.
2. Choose the chart type that matches the claim. Use bar charts for comparing categories, line charts for trends over time, scatter plots for correlations, and simple tables when exact numbers matter more than a visual shape. Pie charts earn their place only when you have two to three segments and the part-to-whole relationship is the actual point.
3. Kill the chart junk. Every gridline, 3D effect, drop shadow, and redundant legend that doesn't help the reader understand faster should be deleted. In PowerPoint, this means stripping the default chart formatting almost entirely before you start. In Google Slides, it means resisting the temptation to keep the auto-generated legend when you can just label the lines directly.
4. Gray everything except the point. Pick the one bar, line, or segment that matters and color it. Make everything else neutral gray. The eye goes to color first — give it exactly one place to go.
5. Annotate directly on the chart. If there's a spike, label it: "Product launch." If there's a trough, label it: "Server outage." Annotations replace paragraphs of verbal explanation and they make the chart work as a standalone document if the deck gets shared without you in the room.
6. Round aggressively. "Roughly 40%" reads faster and lands harder than "39.7%." Unless precision is the entire point — in a financial audit, for example — round to the nearest whole number or sensible figure.
7. Build charts progressively in live presentations. Start with the axis and no data. Reveal one series, talk about it, reveal the next. This works natively in PowerPoint's animation panel and in Keynote. It keeps the audience following your logic instead of jumping ahead to the end of the chart.
8. Use consistent scales across a series of slides. If you show monthly revenue across three slides — January, February, March — the Y-axis range must stay the same. Shifting scales mid-deck makes flat months look like growth. Audiences may not consciously notice, but it erodes trust.
9. Make text big enough for the back row. Test this literally: stand six feet from your own monitor. If you can't read the axis labels, they're too small. For most projector-based presentations, body text on charts should be 18pt minimum.
10. Add one comparison point to every number. A standalone number is forgettable. "40% conversion rate" means nothing. "40% conversion rate — up from 26% last quarter" means everything. Always give the brain a reference point.
11. Put the chart in context with a sentence beneath it. A single line of callout text below the visual — "The gap widens sharply after week three" — does more work than a verbal explanation, because it's readable when the deck circulates without you.
12. Rehearse the sentence you say right before you reveal the chart. The transition into a data slide is where audiences either lean in or check their phone. "Here's something that surprised us" works. "This next slide shows our data" does not.
Applying These Techniques Across Tools
The principles don't change across tools, but the workflows do. In PowerPoint, the Format Data Series panel gives you full control over colors, and the Selection Pane makes it easy to manage layered annotations. The Morph transition is worth learning — it animates changes between slides smoothly, which helps with progressive chart builds without creating dozens of duplicate slides.
In Google Slides, native charting is limited enough that you're usually better off building the chart in Google Sheets or Datawrapper, then embedding it as an image. The trade-off: it looks cleaner, but it won't update automatically unless you use Sheets' linked chart feature.
In Canva, the drag-and-drop chart editor is fast for simple bar and line charts and the color controls are intuitive. It's the right tool when the deck is going to a general audience and design polish matters more than data flexibility. For anything with more than a few data series, Datawrapper or Flourish will give you more precision and better defaults.
One counter-case worth naming: don't apply progressive animation builds to a deck you're sending as a static PDF export. The animations don't survive, and a chart designed around a reveal sequence looks half-finished when it renders flat. If your deck lives as a PDF, every slide needs to work as a fully complete, static image — no build logic, no "this will make more sense when I'm talking over it."
The One Mistake That Undermines All the Others
Every technique in this list is reversible. You can fix a bad chart type, add a missing annotation, resize your text. The mistake that's hardest to fix is presenting data in the order you analyzed it rather than the order your argument needs it.
Analysts naturally walk through their process — here's the raw data, here's how we segmented it, here's the trend, here's the conclusion. Audiences need the reverse: conclusion first, supporting evidence second. Lead with what you found. Then show the data that proves it. Everything else — the exploratory dead ends, the interesting-but-irrelevant segments, the alternative analyses you ran — belongs in an appendix, not the main deck.
See our [Chart Types Guide] for help deciding which chart carries each data point most clearly, and browse the [Examples Gallery] to see these techniques applied across real-world slide designs.
Strong data slides aren't about making charts look beautiful — they're about making arguments feel inevitable. Get the point of view right first, then let the visual earn it.
Frequently Asked Questions
How do you present data in a presentation without losing the audience?
Lead with your conclusion in the slide title, not the chart title. Use one chart per slide, strip out gridlines and decorative elements, and color only the one data point that matters. The audience loses focus when they have to figure out what you're trying to say — your job is to make it impossible to miss.
What is the best chart type for presenting data in a presentation?
Bar charts work best for comparing values across categories, line charts for showing trends over time, and tables when exact numbers matter more than a visual shape. The right chart type depends entirely on the claim you're making — pick the chart that makes your specific argument obvious in under five seconds.
How do you present data in PowerPoint effectively?
Strip the default chart formatting immediately — remove gridlines, unnecessary legends, and 3D effects. Use the Format Data Series panel to set a single accent color on the key data point, gray out everything else, and annotate directly on the chart rather than explaining in body text. Use the animation panel to reveal series progressively in live presentations.
How much data should go on one presentation slide?
Enough to support one argument, and nothing more. A practical test: if you can't state the slide's point in one sentence before showing it, the slide is carrying too much. Split it, trim it, or move supporting data to an appendix. Most good data slides have one chart and fewer than 20 words outside the title.
What is data storytelling in presentations?
Data storytelling is the practice of building a narrative around data — leading with a conclusion, using charts as evidence rather than decoration, and sequencing information the way a persuasive argument moves rather than the way an analysis was conducted. It's the difference between a slide that shows what happened and a slide that explains why anyone should care.
How do you make a data slide work when the deck gets shared without you?
Annotate directly on every chart so the visual is self-explanatory. Write the conclusion as the slide title. Add a one-sentence callout beneath each chart that names the key insight. A deck that requires a presenter to make sense is a deck that stops working the moment it hits someone's inbox.